What we tested and what happened
Our 8 September 2026 study asked one question: given the correct ordered subtask labels, how accurately can the tool place them in time? Each model call received the task, video, episode duration and label list, but no boundary timestamps. One trajectory here means one LeRobot episode.
| Evaluation set | Task groups | Trajectories | Source |
|---|---|---|---|
| L5VEL | 4 | 757 | Imported source references from 16 historical datasets or configurations. |
| RH20T | 39 | 1,305 | The RH20T portion of RoboInter-Data. |
Both sets used Qwen3.8-27B, two sampled frames per second and temperature 0.2. The matched high-budget comparisons allowed up to 300 frames. We reserved ten separate trajectories per task for calibration before evaluating the remainder.
This is not an evaluation of every repository in sBot-Datasets. It excludes the release’s generated annotations and does not test label discovery, other language fields or improvements in policy training.
Read the results
- Native video improved alignment over contact sheets in these runs. At the matched 300-frame budget, temporal overlap rose from 0.410 to 0.513 on L5VEL and from 0.327 to 0.519 on RH20T.
- Calibration raised the average scores. Its gains had wide uncertainty across the four L5VEL task groups. The RH20T calibration analysis is exploratory because its protocol changed after an initial run.
- Timing templates remained strong. Controls fitted from the same ten examples, without video, had temporal-overlap point estimates at or above the best model on both sets. The registered comparison did not establish an overall difference after multiple-test correction.
- A second camera did not show an established benefit. Some point estimates were higher, but the controlled comparison was inconclusive.
In Figure E1, higher is better on both axes. Temporal overlap measures how much predicted spans overlap the reference spans; boundary hit rate counts transitions within three seconds of the reference. The metric definitions explain how missing predictions are scored.
| Configuration | L5VEL tIoU | L5VEL B@3 | RH20T tIoU | RH20T B@3 |
|---|---|---|---|---|
| 60-frame contact sheet | 0.435 | 0.420 | 0.377 | 0.266 |
| 300-frame contact sheet | 0.410 | 0.412 | 0.327 | 0.240 |
| Single native video | 0.513 | 0.521 | 0.519 | 0.383 |
| Single video with calibration | 0.663 | 0.781 | 0.561 | 0.457 |
| Two-view stacked video | 0.533 | 0.550 | 0.520 | 0.413 |
| Stacked video with calibration | 0.687 | 0.789 | 0.566 | 0.473 |
| Equal-duration split | 0.440 | 0.335 | 0.506 | 0.287 |
| Relative-position template | 0.695 | 0.778 | 0.591 | 0.467 |
| Duration template | 0.696 | 0.780 | 0.592 | 0.471 |
Calibration gains, confidence intervals and paired comparisons
| Evaluation set | Video input | tIoU before | tIoU after | Paired gain (95% CI) | Boundaries within 3 s |
|---|---|---|---|---|---|
| L5VEL, 4 task groups | single camera | 0.513 | 0.663 | +0.150 (0.034–0.230) | 52.1% → 78.1% |
| L5VEL, 4 task groups | two views | 0.533 | 0.687 | +0.155 (0.032–0.279) | 55.0% → 78.9% |
| RH20T, 39 task groups | single camera | 0.519 | 0.561 | +0.042 (0.021–0.065) | 38.3% → 45.7% |
| RH20T, 39 task groups | two views | 0.520 | 0.566 | +0.047 (0.026–0.070) | 41.3% → 47.3% |
The paired gains can differ from subtracting the rounded chart values: each contrast uses the trajectories scoreable in both configurations. The intervals resample task groups.
- Native video was stronger than contact sheets in these runs. At the matched 300-frame budget, single-camera video scored 0.513 versus 0.410 for contact sheets on L5VEL, and 0.519 versus 0.327 on RH20T. The paired gains were 0.103 (95% CI 0.042–0.183) and 0.192 (0.160–0.224), and both survived the Holm correction. On RH20T, 4.5% of video outputs failed or were unscoreable, compared with 28.2% for the 300-frame sheets. The shipped 60-frame sheet result is shown separately in Figure E1 because its input budget is smaller.
- Calibration improved timing on both sets. The table above shows gains of 0.150 and 0.155 on the L5VEL task groups, and 0.042 and 0.047 on RH20T. Both RH20T effects survived the planned 24-test Holm correction. The larger L5VEL effects did not: with only four independent task groups, their uncertainty is much wider than for the 39-task RH20T analysis.
- The ten examples transfer less reliably on RH20T. Among calibration groups accepted by the fitter, reference boundary positions varied by about 7.6–8.0% of episode duration on RH20T, compared with 2.4% on L5VEL. The calibration-to-evaluation timing shift was about 4.4–4.5% on RH20T and 0.9% on L5VEL. An exact copy of a held-out trajectory’s ordered label sequence appeared among the ten examples for only 9.7% of RH20T trajectories, compared with 94.5% on L5VEL. This weaker coverage and less stable timing are consistent with the smaller RH20T gain; the study cannot separate task diversity, annotation policy and camera observability into individual causes.
- The seeded timing controls matched the best model on temporal IoU. One control places boundaries at the median relative positions in matching examples. The other takes their median relative segment durations, normalizes them to fill the episode and accumulates them. They scored 0.695/0.696 on L5VEL and 0.591/0.592 on RH20T, compared with 0.687 and 0.566 for calibrated two-view video. These are temporal-IoU point estimates, not a win on every metric: on RH20T the calibrated model’s three-second boundary hit rate was 0.473, slightly above the duration control’s 0.471. The registered comparison did not establish an overall difference after multiple-test correction.
- We did not establish a benefit from a second camera view. The controlled comparison used uncalibrated single- and two-view inputs. The two-view point estimates were sometimes higher, but the evidence was inconclusive.
How the timing controls and failed predictions were handled
A missing predicted span scores zero overlap and its boundary counts as a miss. Missing spans can result from omitted labels, invalid timestamps or an ordering check rejecting a colliding span. These failures stay in the averages; they do not mean a reference label was deleted from the source dataset.
A repeated-label ambiguity made 23 RH20T configuration/trajectory pairs unscoreable: six for each single-video configuration, four for each two-view configuration and three for 300-frame contact sheets. Each comparison uses trajectories scoreable in both configurations. L5VEL has 757 scoreable trajectories in every configuration; RH20T has 1,299–1,305. Scores average within each task, then weight tasks equally.
The three timing controls receive the correct label order and annotated episode start and end, and always return every label. One divides the episode equally. The two seeded controls learn relative boundary positions or segment durations from the same ten examples used by calibration. With fewer than three matching examples, they use equal durations instead; that fallback covers 62 L5VEL and 253 RH20T evaluation trajectories.
These controls test whether video adds information beyond the timing pattern in the examples. They cannot discover which actions happened in a new recording.
Where the reference annotations came from
L5VEL uses only imported source references, excluding the generated collection components. Their original authorship and human verification are not established by the import records. RoboInter’s published workflow describes ChatGPT preannotation followed by human clip segmentation, cross-checking and sampling-based validation. It does not report annotator agreement or detailed acceptance statistics.
Read the accuracy metrics
| Metric | Meaning | Interpretation |
|---|---|---|
Temporal overlapmacro_temporal_iou | For each label, the predicted/reference overlap divided by their combined time span, then averaged. | Higher is better. A missing label scores 0. Predicted spans are stitched to the supplied episode start and end, so those endpoints can improve overlap without being predicted. |
Boundaries within 3 secondsb_hit@3 | The fraction of internal transitions within three seconds of their reference time. | Higher is better. Missing boundaries count as misses. Fixed episode endpoints are excluded. |
Labels placedplaced_fraction | The fraction of supplied labels that received a predicted span. | Higher is better. Read this alongside timing errors to see whether the model omitted difficult cases. |
Error on placed boundariesboundary_mae_placed | Mean absolute error for boundaries the model actually placed. | Lower is better, but this excludes missing boundaries. It should always be reported with labels placed. |
The implementation is in src/lerobot_align/alignment_metrics.py
and evaluation/scripts/score_alignment.py in the
tool repository.
Boundary hit thresholds of 1, 3 and 5 seconds are fixed in the scorer.
How calibration works
Calibration learns how early or late predictions tend to be for a task and how its steps usually divide the episode. It then adjusts new boundaries while preserving their order.
- Reserve ten examples per task. Select them before inference. Keep them separate from evaluation; a failed example is not replaced.
- Fit a timing correction. Each camera configuration gets its own fit. At least three complete, correctly ordered predictions are needed for a task/subtask-count group.
- Check and freeze the fit. Leave-one-out checks choose a duration weight. Only accepted fits are applied to held-out predictions.
- Keep fallbacks in the results. Unsupported counts, rejected fits and failed calibration attempts retain the raw prediction. Calibration cannot recover a missing label.
Single-camera calibration applied to 507 of 757 L5VEL trajectories and 659 of 1,305 RH20T trajectories. All remaining fallbacks stay in the reported averages.
Exact selection rule, equations and acceptance thresholds
L5VEL and RH20T use the same evaluator. The repository retains
corpus_a and corpus_b as internal keys for L5VEL and
RH20T, respectively; those names are not separate methods. For each task, the
preparer sorts SHA-256 hashes of
1729:task:source_id:local_episode and reserves the first ten
distinct annotated trajectories. This choice is fixed before model inference
and does not inspect label contents or prediction quality. The ten trajectories
are put in a seed-only dataset; every other trajectory is put in evaluation-only
components. A failed seed is recorded and never replaced.
Each camera configuration uses those same ten identities but makes its own predictions and fits its own parameters. Fits are grouped within task by subtask count, and require at least three complete predictions with the supplied labels in the right order. The study uses count scope, so it assumes the first, second, and later positions represent comparable task phases even when their wording differs. With predicted internal boundary pij, reference boundary gij, and stitched predicted extent Ti, the position correction is:
offset_j = median_i((p_ij - g_ij) / T_i)
The fitter also stores median reference segment durations divided by
Ti. Leave-one-out scoring on the retained seeds selects a
duration weight from {0, 0.25, 0.5, 1, 2, 4}. The fit is recommended
only when this check gains at least 0.03 temporal IoU and the raw first-boundary
mean absolute error is at least 1.5 s. Because the same folds select the
weight and estimate its gain, this check is optimistic rather than an independent
evaluation.
Accepted parameters are frozen. On a held-out prediction, a dynamic program on a 0.1-second grid shifts all internal boundaries together, balancing corrected model times against the duration pattern while keeping positions nondecreasing. The duration fractions are not renormalized by the calibrator, and a later strict-order cleanup can reject colliding labels. Calibration cannot restore a label omitted by the model. Unsupported subtask counts, rejected fits and failed calibration attempts keep the matching raw prediction. Single-camera calibration applied to 507 of 757 L5VEL trajectories and 659 of 1,305 RH20T trajectories; every fallback remains in the published averages. The public calibration protocol documents the identity maps, hashes and runtime skip reasons.
What limits the conclusions
- Known labels make this a narrower task. Timing controls also receive the correct label order and annotated episode extent. Their performance does not establish how well an annotation tool discovers actions in a new video.
- Calibration comparisons include model variation. Calibrated and uncalibrated configurations used separate calls at temperature 0.2.
- RH20T calibration results are exploratory. The protocol was revised after a preliminary null result, with changes expected to help calibration.
- Reference agreement is unknown. Neither set has a human-to-human agreement measurement in this study.
- Exact replay is limited. Model-weight revisions were not pinned, and the historical predictions and fits are not included in the public release.
Additional limitations of the small-sample calibration fit
Median duration fractions are not renormalized: accepted priors sum to 0.972–0.999 on L5VEL and 0.858–1.117 on RH20T. The same three to ten usable seeds choose the duration weight and estimate its leave-one-out benefit; the bias gate checks only the first boundary. These choices can make the fit optimistic or unstable.
Compare visual tokens
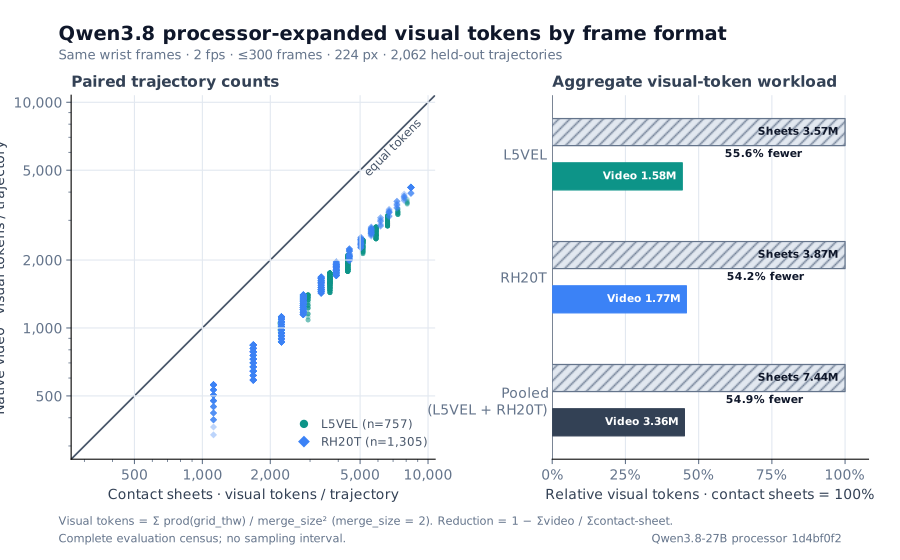
Native video used 54.9% fewer visual tokens overall than contact sheets made from matching frames. This separate count uses the Qwen3.8-27B processor and all 2,062 held-out trajectories: 757 L5VEL and 1,305 RH20T.
Both formats use the same wrist-camera timestamps at two frames per second, at most 300 frames, resized to 224 pixels wide. Those frames become either 5×4 contact sheets or one native-video clip. The reduction is 55.6% on L5VEL and 54.2% on RH20T.
| Population | Trajectories | Contact-sheet visual tokens | Native-video visual tokens | Video relative to sheets | Reduction |
|---|---|---|---|---|---|
| L5VEL | 757 | 3,568,425 | 1,584,275 | 44.4% | 55.6% |
| RH20T | 1,305 | 3,869,040 | 1,771,784 | 45.8% | 54.2% |
| Pooled (L5VEL + RH20T) | 2,062 | 7,437,465 | 3,356,059 | 45.1% | 54.9% |
1d4bf0f2; source rows, summary and validation.This measures visual input tokens under those settings. It does not establish savings in billing, latency, generated tokens or total tokens, and it does not measure annotation accuracy. Changing resolution, sampling or sheet layout can change the result.
How tokens were counted and checked
We count visual tokens as
Σ product(grid_thw) / merge_size², using
image_grid_thw for the sheets and video_grid_thw
for video. Qwen’s official
video processor configuration
uses 16-pixel spatial patches, merges them 2×2, and groups video frames
in temporal pairs. Contact sheets also pay for a complete
5×4 canvas when their last sheet is only partly filled. Together, these
choices explain the reduction here; changing the sampling rate, resolution or
sheet layout can change it. Qwen’s model card documents native image and
video input and configurable processor budgets. It does not itself claim that
video is always cheaper than contact sheets.
We checked the metadata-derived census against decoded pixels. Six examples at fixed short, median and long frame-count ranks had processor grids and visual placeholders that matched the census exactly; both representations also completed in 12 local Qwen3.8-27B requests. This validates the counting path and payload compatibility, not total cost or throughput. Hardware and run-manifest details are in the reproduction notes.
This is a visual-token result. It does not measure generated tokens, billing, latency or annotation accuracy, and native video adds timestamp text around its visual tokens. Figure E1 reports accuracy separately. We exclude server token telemetry because the available vLLM counters treated the two modalities inconsistently and therefore cannot support a cross-format comparison. The reproduction notes describe the scripts, validation and limits.
Reproduce a measurement
Choose the measurement first. The public repository contains the methods, but each run needs different inputs. In particular, public code alone cannot regenerate the archived accuracy scores.
| Measurement | Available | Needed to rerun |
|---|---|---|
| Visual tokens | Rows, summary, validation receipt and plot. | Prepared evaluation corpora and the pinned processor. Decoded-media validation also needs video. |
| Alignment accuracy | Metric code, configuration definitions, scorer and bootstrap aggregation. | Source reference boundaries, prepared media and a model endpoint. Exact aggregate replay additionally requires the unpublished historical predictions and fits. |
| Wall-clock timing | A paired per-episode runner. | A dataset and model endpoint, with cache and run order controlled. |
| Job telemetry | The evaluation job runner. | Prepared source data and an exclusively held model replica. Compare server token counters only within the same visual format. |
Run the commands from a lerobot-align
checkout, with Python 3.12, uv and FFmpeg installed.
Follow the
corpus preparation guide first. Replace each angle-bracket placeholder with
your prepared data path or endpoint; corpus_a means L5VEL and
corpus_b means RH20T.
Rerun the visual-token count
1. Install dependencies and pin the processor
uv sync --locked --extra eval --extra serve
export ALIGN_QWEN_REV=1d4bf0f2ff6012fd82039f2fa52739d0dd7c60c0
export ALIGN_QWEN_PROCESSOR="$PWD/.cache/qwen38-processor-$ALIGN_QWEN_REV"
uv run --no-sync hf download Qwen/Qwen3.8-27B \
  config.json preprocessor_config.json video_preprocessor_config.json \
  tokenizer_config.json tokenizer.json chat_template.jinja \
  --revision "$ALIGN_QWEN_REV" --local-dir "$ALIGN_QWEN_PROCESSOR"
2. Count both formats
uv run --no-sync python evaluation/scripts/measure_frame_format_tokens.py \
  <prepared_corpus_a> <prepared_corpus_b> \
  --processor "$ALIGN_QWEN_PROCESSOR" --local-files-only \
  --rows-out rows.jsonl --summary-out summary.json
3. Check sampled frames against decoded media
uv run --no-sync python evaluation/scripts/validate_frame_format_tokens.py \
  --rows rows.jsonl \
  --corpus-root corpus_a=<prepared_corpus_a> \
  --corpus-root corpus_b=<prepared_corpus_b> \
  --processor "$ALIGN_QWEN_PROCESSOR" --local-files-only --pairs-per-corpus 3 \
  --out validation.json
4. Attach validation to the count
uv run --no-sync python evaluation/scripts/measure_frame_format_tokens.py \
  <prepared_corpus_a> <prepared_corpus_b> \
  --processor "$ALIGN_QWEN_PROCESSOR" --local-files-only \
  --rows-out rows.jsonl --summary-out summary.json \
  --actual-pairs validation.json
5. Generate the plot
uv run --no-sync python evaluation/scripts/plot_frame_format_tokens.py \
  --rows rows.jsonl --summary summary.json \
  --svg figure3.svg --png figure3.png
The census reproduces the 2 fps, 300-frame, 224-pixel evaluation
geometry without decoding pixels, then verifies the population against
the prepared split manifests. The validator selects fixed length ranks,
decodes the real frames and requires its image_grid_thw,
video_grid_thw and input placeholder counts to match. Add
--api-base <endpoint> --model <served_id> --gpu-index
                            <index>
to repeat the live-server check. The server should use
--media-io-kwargs
                            '{"video": {"num_frames": -1}}'
so it does not cap
a clip at 32 frames. For a one-episode processor check, run
uv run --no-sync python -m lerobot_align.diagnostics.probe_frame_tokens
                            <dataset_root> --episode 0 --camera observation.images.wrist
.
None of these cross-format calculations uses
usage.prompt_tokens. The published run used processor revision
1d4bf0f2ff6012fd82039f2fa52739d0dd7c60c0. For an exact
rerun, use the explicit six-file download above and verify the config hashes
recorded in summary.json.
Measure paired wall-clock time or job telemetry
Paired per-episode wall-clock
python -m lerobot_align.diagnostics.eval_align_batch \
    <dataset_root> --formats contact_sheet video \
    --video-fallback error --camera observation.images.wrist \
    --api-base <endpoint> --model <served_id> --out ab.json
Both formats run back to back within each episode. Contact sheets run first, and the shared frame provider caches decoded frames, so video can benefit from a warmer cache. Warm both formats or counterbalance their order before interpreting the timing difference.
Keep --video-fallback error to fail the run if video encoding
fails; the default can fall back to contact sheets. The reported
elapsed_s includes local decoding and H.264 encoding as well
as the model call.
End-to-end job telemetry
python evaluation/scripts/run_arm.py \
    --dataset <component> --source-root <dataset_root> \
    --work-dir <scratch_directory> \
    --arm align_video__udef__wrist \
    --arms-config evaluation/configs/arms.yaml \
    --base-url <endpoint> --model-id <served_id> \
    --out video-job.json
Repeat with the same inputs and
--arm baseline_upstream__udef__wrist --out upstream-job.json.
For a subset, give both runs the same --episodes <split.json>.
Each job needs exclusive use of its model replica for the whole run so
the counter differences contain only that job’s traffic.
Outputs include elapsed_seconds, n_episodes_predicted
and server counters for prompt, generation and total tokens. Compare those
token counters only within the same visual format. For a contact-sheet
versus video token comparison, use the processor count above.
For a new accuracy run, use the preparation guide above with your source references, media and model endpoint. Its configurations and scorer support repeating the protocol; they do not supply the missing historical outputs.
Working with robot data?
Tell us what you’re building with the data, or share an episode that the annotation tool found difficult.
support@l5vel.com